DST Lezione 24
Diagrams and designing decisions
Before designing a diagram for a system we need to answer these key questions:
- What are the data sources that you have to check?
- What are data types?
- What is data volume? How many data do i need to store?
- What kind of query requirements you have?
As always there isn’t an optimal solution and there are trade off in different choices. For example, on such trade-off is throughput (how much data you can process) and latency (time to get an answer). Both requires very expensive systems.
In software design, most diagrams are UML-based. UML was born as standard universal language for modelling software. You have different kind of UML diagrams for different kind of software design and managing. UML as also born for miming object oriented software, in fact the first diagram is the Class Diagram.
Some people in the industry argue that UML can function as a programming language with CASE tools generating source code from UML diagrams, turning it into a graphical programming language.
However, when you need to add detail to your application, you see that using UML as programming language has no clear advantage over traditional coding. There’s ongoing debate about UML’s role in replacing traditional programming languages.
When it comes to data, UML is less effective. It was created for software, not data management, lacking suitable models for data handling and non-relational systems. There are some diagrams for relational systems, like ER diagrams, but no universal standard exists for designing data architecture.
We’ll see:
- Component Deployment Diagrams from UML
- Data Flow Diagrams (DFD)
Component Diagram
In UML there is an interoperability of symbols between diagrams. If you use a symbol in one diagram, you can use that also in another diagram. There are also a mechanism called stereotype that allows to design new types. We will no use extention mechanism because there is no universal acceptance. Software components is a vague definition, could be an operating system, a library, could be a monolithic application, a microservice architecture, don’t expect to have an unique answer: you are the design, you design what’s a component and what’s another component. There is no universal rule.
UML Component Diagram
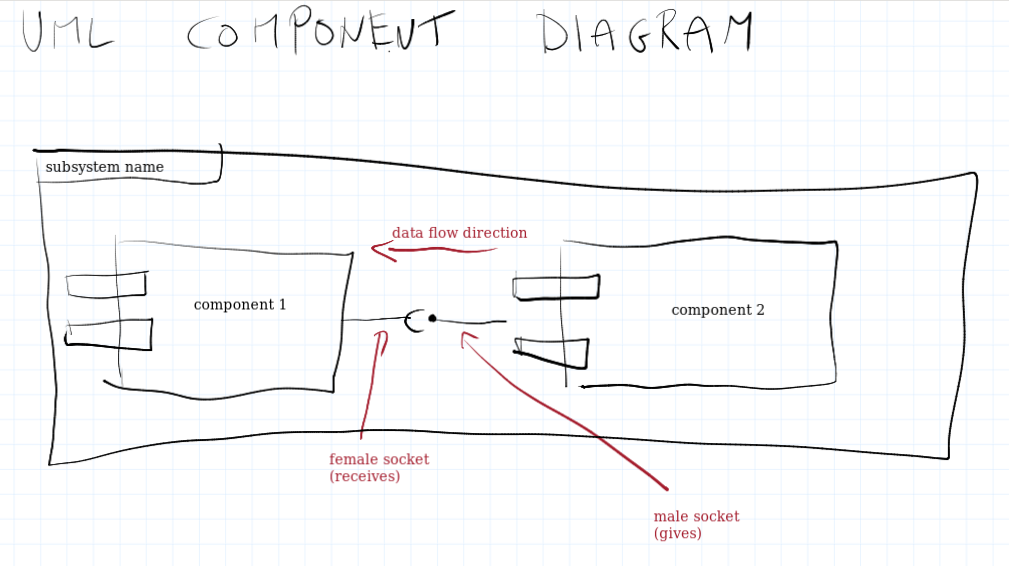
A component is loosely defined. The definition is given by the designer. A component could be an operating system i.e. Linux, that contains subcomponents i.e. Tomcat server, and so on. Or it could a web interface or a piece of the software with a certain responsability.
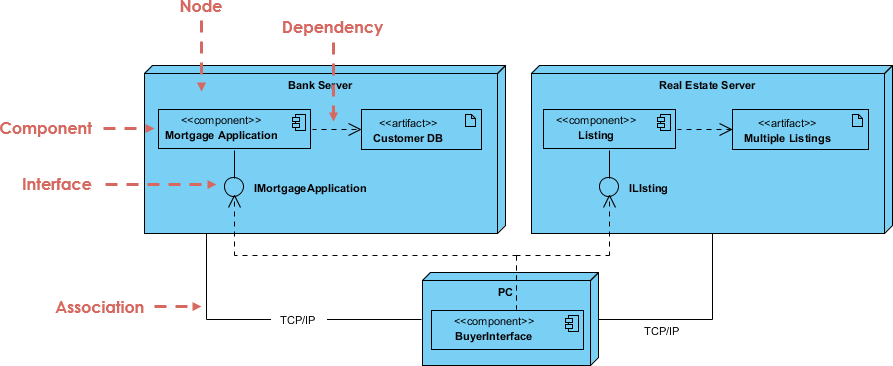
Deployment UML diagram

There is not a standard notation for recognizing cloud resources. So for this course we will use the notation <<cloud>> to say if it’s cloud based (or not).
Mixing Component and Deployment Together
Mix of component and deployment: You could like put uml components inside the cubes of deployment diagram, in this way you could represent both the component and the associated hw resources required.
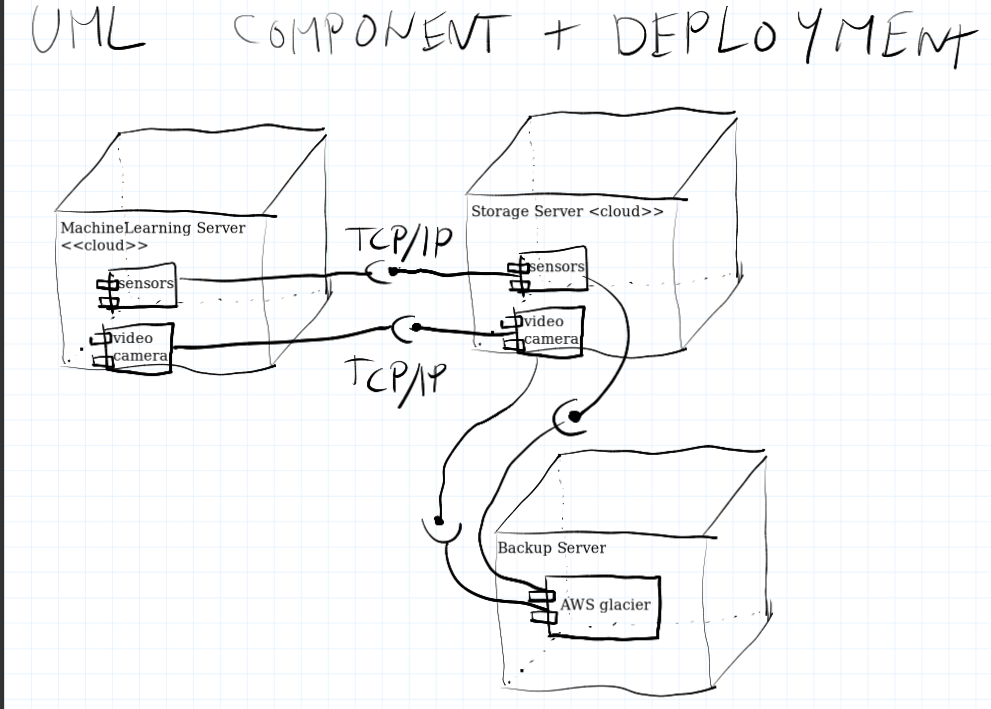
In this example we have an example of system for surveillance where one source of data is from videocameras and another is from sensors, on which Machine Learning Algorithms are runned. So we create a simple system with three hardware resources: a backup server, a storage server that receives data from sensors and videocameras, and an hardware resource that provides computational power for machine learning. Five modules are employed: the machine learning module for sensors, the machine learning module for video camera (different algorithm, parameters and so on, so it makes sense). Then we have two module for sensors and videocamera (that probably require different technologies for storage, like videocameras will require a shared folder, while sensors a key-value store). And another component is a backup folder of a high latency (and low cost) server.
What we have gained from this? From UML, with a deployment component diagram you get an idea on how many software you get and how many components. You can futher improve and refine the diagram to include the volume of data and the cost of the hardware.
Data Flow Diagrams
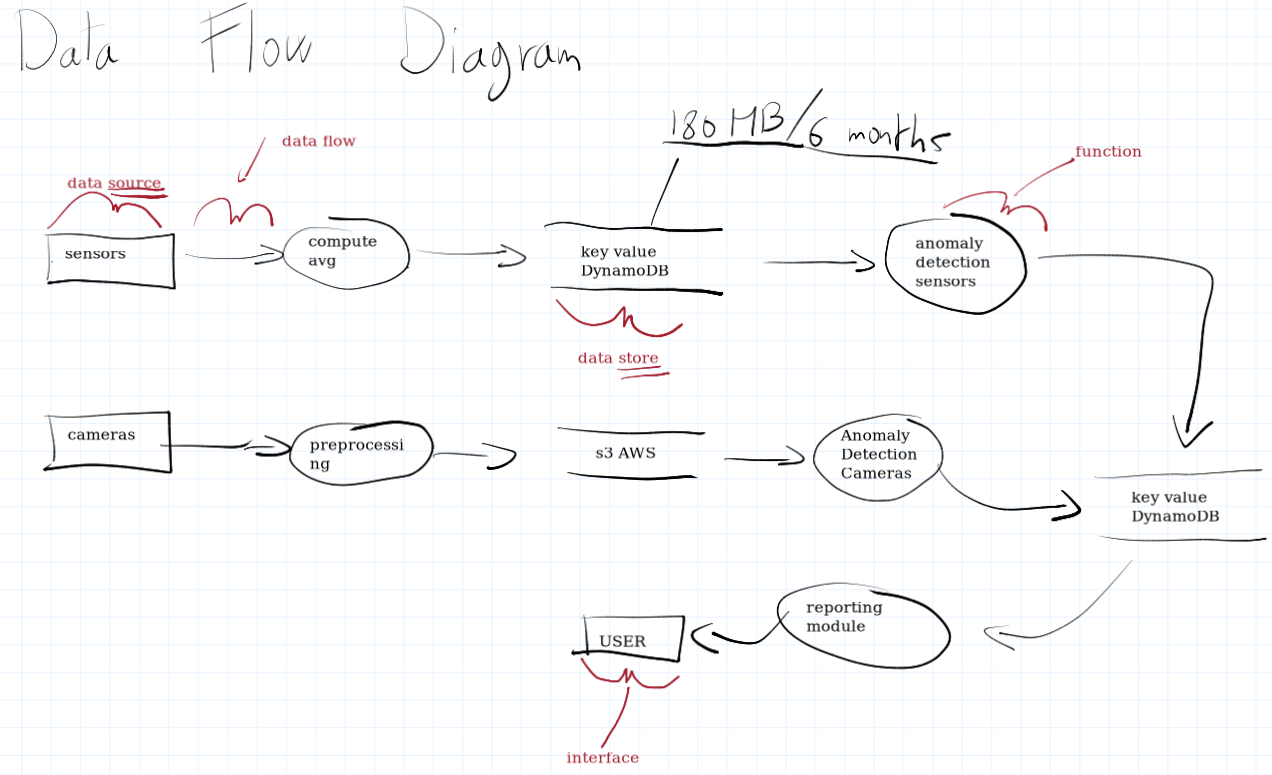
Mainly represent where data comes from and where data goes to. There is also volume that gives you an idea on how much data does transit in your system. Volume could be like GB for seconds, for day and so on.
Put it all together
Looking at the data flow and previous diagrams, you might end up with a setup like this: one virtual server for data, running both key-value and RDBMS components, and another server for preprocessing and analytics. That’s one option.
Alternatively, you could have separate servers for RDBMS and the key-value store, plus another for analytics and preprocessing. It all depends on the data volume and size. Just two diagrams can give you a good idea of the power needed for storage.
The challenge today is scalability. If your app is simple, like a smartphone app with basic data storage, it needs to scale if it goes viral. So it must be moved to the cloud. If possible, when you design the application you must think how to scale it. Cloud systems scale easily thanks to their “elastic” nature (scal up and down).
Another example, say you know your client data and growth rate, then you can manage without worrying too much about scaling.
Proper data design is crucial for optimal scaling. If your design isn’t efficient, no amount of money can fix scaling issues. You need to plan how to store data, which system to use, and how to optimize each part. It all depends on your specific case.
https://circle.visual-paradigm.com/deployment-diagram-with-components/