DST Lezione 20 - Data Warehouses
Sources:
- Fundamentals of Database Systems Seventh Edition | Chapter 29
Data warehouses are a very old technology in computer science, born in the 90s. A data warehouse is a repository for data, and the difference from a regular database is mainly based on the purpose for which you keep the data.
If you are a big supermarket company like Walmart, ofcourse you would need a database to hand the supplies, the stock of goods in each supermarket, manage the clients. Everything to support the activities of regular users and of the super market.
Data Warehouses and OLAP, DSS and OLTP
Datawarehouses support several type of applications:
- OLAP: Online Analytical Processing: is a term used to describe the analysis of complex data from the data warehouse. In the hands of skilled knowledge workers, OLAP tools enable quick and straightforward querying of the analytical data stored in data warehouses and data marts
- DSS decision-support system is a system that helps big managers and executives in leading decision with analyitical complex data.
- OLTP - online transaction processing: they are supported by traditional databases but data warehouses are designed precisely to support OLTPs.
Characteristics of Data Warehouses: OLTP vs OLAP
E.T.L
Data warehouses has different sources of data like:
- Relational data from databases you own
- JSON data from NoSQL systems
- Web scraped data
Generally speaking, it is desiderable to collect as much data as possible and there is always new data to save and organize. The problem is that data comes in different format, standard and schema. So a critical part of data warehouse is insertion that is managed by ETL:
- (E)xtract
- (T)ransport
- (L)oad This job is often done by hand.

Data Ingestion Capacity and Data Lake
Data Ingestion Capacity of the system: what is the load of data you can handle, i.e 1GB/s. If you data input throughput is more than 1GB then you need an auxliary server to redirect the data, often called data lake. In that case, you switch the order of the operation of the E.T.L, and do ELT (Extract, Load, Transport).
In practice, a Data Lake is a buzzword for saying a key-value store. You put a key on your data without any kind of transformation and load it into the data lake. Using a key-value store means also that you have no schema, no design and no transformations. In fact, it is often called GIGO: Garbage In, Garbage Out. The targetting user of a data lake is usually the data scientist.
To recap briefly:
- The Data Lake used by the data scientist
- The DSS is used by executives
Data Marts
Data marts are target to a subsef of the organization and more tighly focused. It’s like a subset of the Data Warehouse.
Data Retention
The business standard is to keep data for 7 years. The most used policy is called Roll-in, Roll-out. Think of it like a conveyor belt: new data gets added at the start, and old data at the end gets discarded or backed up to cheaper, slower storage. Data Retention: the business standard is 7 years of data. (frozen data)
Data Warehouses Schemas: Star Schema
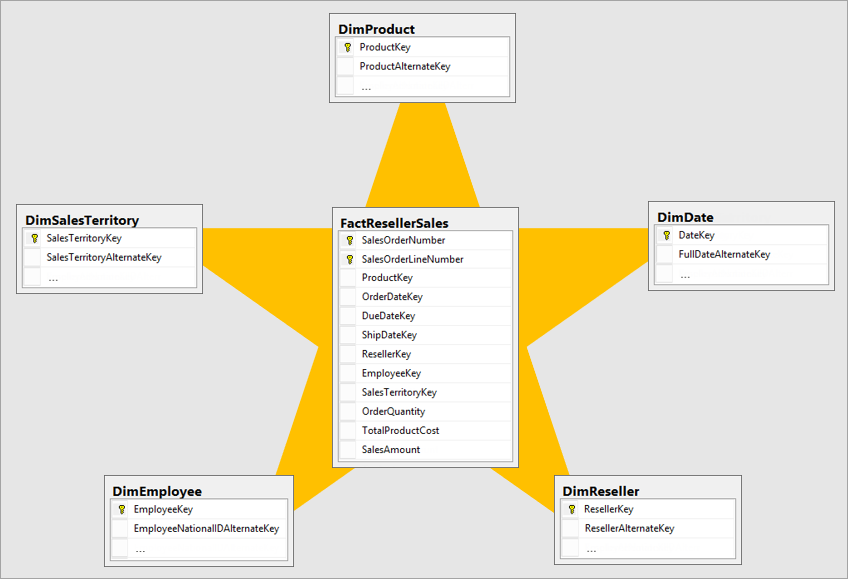 Star schema: you have one central table that is called fact table. Then you have dimensions tables.
A Fact Table contains usually one or more main fields, for example in FactResellerSale it could be the number of units that you sold. (But it could also be how much dollar you made). Then you have the remaining fields that are also foreign keys to dimensions table on the side.
Dimension tables are used to analyze data through queries, i.e. i would like to see the graph of the sales, so i use the DimDate table.
Redundancy in Star Schema
There is something wrong from relational perspective: normalization and functional dependencies. For example in a Territory Dimension Table, if i have as fields region, nation and so on…region determines nation so it’s redundant.
What if we don’t want redundancy? We get a snowflake schema. But we also pay more computational time because we do multiple joins to get the data we want, and it’s umanageable because data warehouses handle even billions of data. Memory is cheap and not an issue nowdays.
Materialized views and Data Warehouses.
Tthere is a theory that says that data warehouses are actually materialized views.
Why redundancy in the the star schema redundancy works for data warehouses
ETL are systems where there are not conflicting operations. Usually data is never modified but only inserted. Also, the most frequent operation is reading. So incosistencies of copies with redundancy doesn’t happens unless the ETL pipeline is flawed. The job of the ETL is also to check for incosistencies.
This kind of data is WORM: Write Once, Read Many. This data never get updated: you just add more data. There is no risk. If it is well done, that is the guarantees that the system is well done. You never update that value in general, so you have redundancy, a lot, but no risk of losing incosistencies because you only read. (puntatore a lezione dove si parla di questo)
Example of a query
Say i want to know in the last six month, in the city of rome what is the volume of data. What i do is a simple aggregation by joining the fact table with the proper dimensione table and read the result. The reason you have these attributes with redundancy is to have possible aggregation candidates ready to use; thus preparing the data in such a way that it is most efficient to aggregate.
The data from this example query could be used to show a graph with trend of selling.
Data Warehouses Schema: Snowflake schema
Another type of schema is the Snowflake schema. It’s the normalized version of a star schema, so here it would split into multiple tables like: each dimensione table could have more table. You are doing this to reduce the redundancy. It’s the opposite of Star schema.
Data Warehouses Schema: Constellation Schema
Constellation Schema: when you use two or more fact table that share most of the dimension tables.
Data Warehouses and Hypercubes

Suppose we have three dimensions:
- Time
- Space
- Product Type
If we do a 3-D Plot, we could have time on one axis, space on another axis and type on the third one. We have one cell of the cube for each combination of the parameter. In each cell there is the volume, in moneys or units or whatever. For example if you want to know the volume of foods sold in florence in the first semester of 2023 - a cell would correspond to this and it would be a value i.e. 2348.
Hypercube operations
Hypercube or OLAP cube is just another possible view of the data you have in the data warehouse.
The OLAP Cube is what can be shown to exectuvies (they wouldn’t understand the star schema and underlying techie stuff). Here are some common operations:
- Pivoting: Rotates the cube to show different dimensions, like switching from a time-space view to a type-time view.
- Slice: Cuts the cube to show a specific subset, like only beverages sold across all times and places, resulting in a 2D graph (SQL equivalent:
WHERE TYPE='beverage'). - Dice: Creates a smaller cube by selecting an interval of values..
- Roll up: Aggregates data to a higher level, like summing sales by region instead of by city.
- The extreme case would be the sum of all the volume of sales, it would be a single value.
- Drill down: The opposite of roll up, it breaks down data to a finer level, like going from region-level data to city-level data. The finest level depends on your schema design.
Example - granularity of data in the design
Imagine a big manager at Carrefour deciding whether to open a new store near you. They have client data, but at what level should they keep it? A city level makes sense. The manager doesn’t need your personal data; they’re interested in aggregated data like how many people bought certain items.
The level of detail in data storage depends on the schema design. For instance, while you could technically store sales data by the second, it’s more practical to store it by half-day or daily. If data is stored by day, you can’t drill down further than daily details, only roll up to higher levels of aggregation.
Indexing in Data Warehouses
Suppose most query have low selectivity, what is the most convenient index to use in data warehouses? The bitamp indexing. You could also use materialized views: you can pre-compute them to gain a speedup on some queries. The strenght of data warehouses is that data doesn’t need to be update often (and we know that’s problem with indexing).
Materialized views require more space yes, but usually memory is cheap and if you can afford a Data Warehouse you can afford to pay for memory.
Fully managed Warehouses Systems
One trend, as often happens in IT, is to sell ready to use warehouse systems, with hardware + software packed together, and it’s fully “self-managed”. Traditionally if you don’t want this, you need to buy servers and hire people with expertise.